
From Wikipedia, the free encyclopedia
Content deleted Content added
|
|
|||
| Line 1,003: | Line 1,003: | ||
|
| map_image = 2016 Mississippi’s 3rd congressional district election by county.svg |
| map_image = 2016 Mississippi’s 3rd congressional district election by county.svg |
||
|
| map_size = 230px |
| map_size = 230px |
||
|
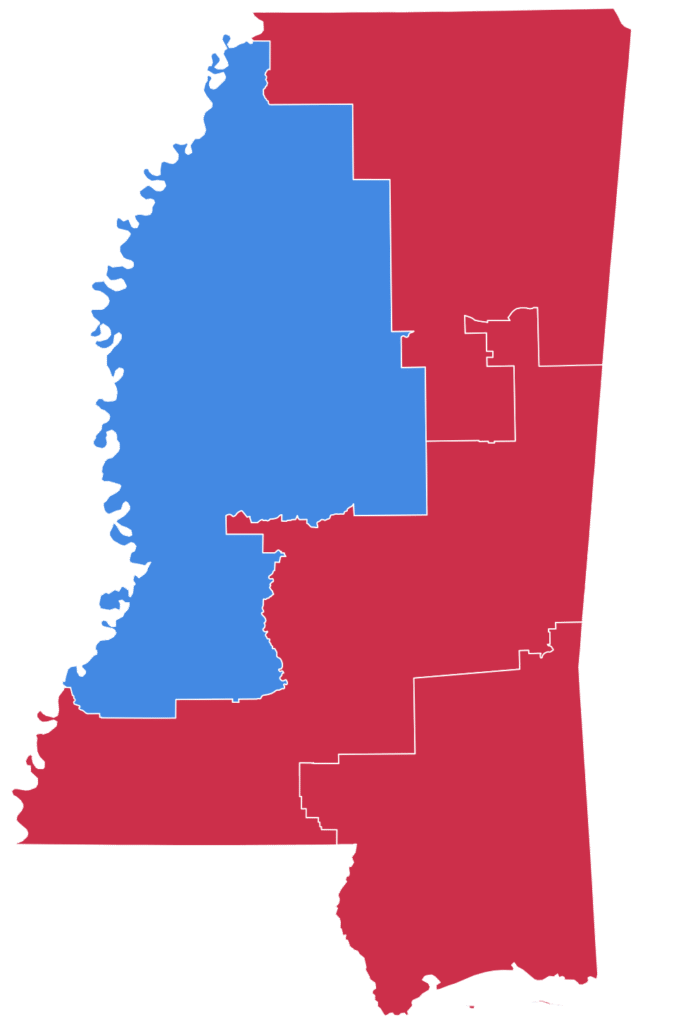
| map_caption = County results<br />”’Harper:”’ {{legend0|# |
| map_caption = County results<br />”’Harper:”’ {{legend0|#|40–50%}} {{legend0|#|50–60%}} {{legend0|#|60–70%}} {{legend0|#|70–80%}}<br/>”’Quinn:”’ {{legend0|#|40–50%}} {{legend0|#|50–60%}} {{legend0|#|60–70%}} |
||
|
| title = U.S. Representative |
| title = U.S. Representative |
||
|
| before_election = [[Gregg Harper]] |
| before_election = [[Gregg Harper]] |
||
Latest revision as of 19:34, 4 February 2026
|
||||||||||||||||||||||||||||
 
|
||||||||||||||||||||||||||||
The 2016 United States House of Representatives elections in Mississippi were held on November 8, 2016, to elect the four U.S. representatives from the state of Mississippi, one from each of the state’s four congressional districts. The elections coincided with the 2016 U.S. presidential election, as well as other elections to the House of Representatives, elections to the United States Senate and various state and local elections. The primaries were held on March 8.
| 2016 United States House of Representatives elections in Mississippi | |||||
|---|---|---|---|---|---|
| Party | Votes | Percentage | Seats | +/– | |
| Republican | 680,810 | 57.58% | 3 | – | |
| Democratic | 449,896 | 38.05% | 1 | – | |
| Libertarian | 20,868 | 1.77% | 0 | – | |
| Independents | 15,614 | 1.32% | 0 | – | |
| Reform | 15,085 | 1.28% | 0 | – | |
| Totals | 1,182,273 | 100.00% | 4 | — | |
Results of the 2016 United States House of Representatives elections in Mississippi by district:
|
County results |
|
|
|

Incumbent Republican Trent Kelly, who had represented the district since 2015 ran for re-election. He won a special election to replace Alan Nunnelee (who died on February 6, 2015) with 70% of the vote in 2015 and the district had a PVI of R+16.
Eliminated in primary
[edit]
| County[7] | Trent Kelly Republican |
Jacob Owens Democratic |
Various candidates Other parties |
Margin | Total | ||||
|---|---|---|---|---|---|---|---|---|---|
| # | % | # | % | # | % | # | % | ||
| Alcorn | 11,262 | 80.25% | 2,337 | 16.65% | 434 | 3.09% | 8,925 | 63.60% | 14,033 |
| Benton | 2,168 | 57.66% | 1,397 | 37.15% | 195 | 5.19% | 771 | 20.51% | 3,760 |
| Calhoun | 4,616 | 73.42% | 1,534 | 24.40% | 137 | 2.18% | 3,082 | 49.02% | 6,287 |
| Chickasaw | 4,441 | 58.38% | 2,950 | 38.78% | 216 | 2.84% | 1,491 | 19.60% | 7,607 |
| Choctaw | 2,866 | 73.34% | 930 | 23.80% | 112 | 2.87% | 1,936 | 49.54% | 3,908 |
| Clay | 4,631 | 47.81% | 4,777 | 49.31% | 279 | 2.88% | -146 | -1.51% | 9,687 |
| DeSoto | 42,838 | 67.37% | 17,972 | 28.26% | 2,776 | 4.37% | 24,866 | 39.11% | 63,586 |
| Itawamba | 8,374 | 87.60% | 903 | 9.45% | 282 | 2.95% | 7,471 | 78.16% | 9,559 |
| Lafayette | 11,466 | 60.57% | 6,676 | 35.27% | 788 | 4.16% | 4,790 | 25.30% | 18,930 |
| Lee | 23,897 | 74.27% | 7,562 | 23.50% | 719 | 2.23% | 16,335 | 50.76% | 32,178 |
| Lowndes | 13,853 | 56.00% | 10,037 | 40.58% | 846 | 3.42% | 3,816 | 15.43% | 24,736 |
| Marshall | 6,697 | 48.43% | 6,514 | 47.11% | 617 | 4.46% | 183 | 1.32% | 13,828 |
| Monroe | 10,586 | 68.64% | 4,465 | 28.95% | 372 | 2.41% | 6,121 | 39.69% | 15,423 |
| Oktibbeha (part) | 950 | 59.12% | 606 | 37.71% | 51 | 3.17% | 344 | 21.41% | 1,607 |
| Pontotoc | 10,515 | 83.06% | 1,790 | 14.14% | 355 | 2.80% | 8,725 | 68.92% | 12,660 |
| Prentiss | 7,778 | 80.99% | 1,633 | 17.00% | 193 | 2.01% | 6,145 | 63.98% | 9,604 |
| Tate | 7,306 | 65.54% | 3,404 | 30.53% | 438 | 3.93% | 3,902 | 35.00% | 11,148 |
| Tippah | 6,973 | 78.34% | 1,677 | 18.84% | 251 | 2.82% | 5,296 | 59.50% | 8,901 |
| Tishomingo | 6,841 | 84.58% | 960 | 11.87% | 287 | 3.55% | 5,881 | 72.71% | 8,088 |
| Union | 9,295 | 82.89% | 1,636 | 14.59% | 283 | 2.52% | 7,659 | 68.30% | 11,214 |
| Webster | 3,995 | 80.54% | 817 | 16.47% | 148 | 2.98% | 3,178 | 64.07% | 4,960 |
| Winston | 5,107 | 58.57% | 3,370 | 38.65% | 242 | 2.78% | 1,737 | 19.92% | 8,719 |
| Totals | 206,455 | 68.72% | 83,947 | 27.94% | 10,021 | 3.34% | 122,508 | 40.78% | 300,423 |
|
County results |
|
|
|

Incumbent Democrat Bennie Thompson, who had represented the district since 1993, ran for re-election. He won re-election with 68% of the vote in 2014 and the district had a PVI of D+13.
| County[7] | Bennie Thompson Democratic |
John Bouie II Republican |
Various candidates Other parties |
Margin | Total | ||||
|---|---|---|---|---|---|---|---|---|---|
| # | % | # | % | # | % | # | % | ||
| Attala | 3,642 | 45.24% | 3,830 | 47.58% | 578 | 7.18% | -188 | -2.34% | 8,050 |
| Bolivar | 9,492 | 70.34% | 3,515 | 26.05% | 488 | 3.62% | 5,977 | 44.29% | 13,495 |
| Carroll | 2,026 | 37.40% | 2,949 | 54.44% | 442 | 8.16% | -923 | -17.04% | 5,417 |
| Claiborne | 3,733 | 87.24% | 455 | 10.63% | 91 | 2.13% | 3,278 | 76.61% | 4,279 |
| Coahoma | 6,524 | 75.10% | 1,882 | 21.66% | 281 | 3.23% | 4,642 | 53.44% | 8,687 |
| Copiah | 7,279 | 57.18% | 4,925 | 38.69% | 526 | 4.13% | 2,354 | 18.49% | 12,730 |
| Grenada | 5,133 | 50.37% | 4,614 | 45.28% | 444 | 4.36% | 519 | 5.09% | 10,191 |
| Hinds (part) | 61,779 | 75.59% | 17,773 | 21.75% | 2,172 | 2.66% | 44,006 | 53.85% | 81,724 |
| Holmes | 6,725 | 84.20% | 930 | 11.64% | 332 | 4.16% | 5,795 | 72.56% | 7,987 |
| Humphreys | 2,900 | 76.46% | 765 | 20.17% | 128 | 3.37% | 2,135 | 56.29% | 3,793 |
| Issaquena | 421 | 62.09% | 227 | 33.48% | 30 | 4.42% | 194 | 28.61% | 678 |
| Jefferson | 3,346 | 87.52% | 396 | 10.36% | 81 | 2.12% | 2,950 | 77.16% | 3,823 |
| Leake | 4,041 | 49.24% | 3,625 | 44.17% | 540 | 6.58% | 416 | 5.07% | 8,206 |
| Leflore | 7,894 | 72.07% | 2,688 | 24.54% | 371 | 3.39% | 5,206 | 47.53% | 10,953 |
| Madison (part) | 9,415 | 80.32% | 2,030 | 17.32% | 277 | 2.36% | 7,385 | 63.00% | 11,722 |
| Montgomery | 2,426 | 49.99% | 2,201 | 45.35% | 226 | 4.66% | 225 | 4.64% | 4,853 |
| Panola | 7,974 | 54.55% | 5,968 | 40.82% | 677 | 4.63% | 2,006 | 13.72% | 14,619 |
| Quitman | 2,379 | 72.49% | 770 | 23.46% | 133 | 4.05% | 1,609 | 49.02% | 3,282 |
| Sharkey | 1,581 | 73.84% | 500 | 23.35% | 60 | 2.80% | 1,081 | 50.49% | 2,141 |
| Sunflower | 7,052 | 74.31% | 2,084 | 21.96% | 354 | 3.73% | 4,968 | 52.35% | 9,490 |
| Tallahatchie | 3,744 | 65.06% | 1,732 | 30.10% | 279 | 4.85% | 2,012 | 34.96% | 5,755 |
| Tunica | 2,611 | 75.77% | 731 | 21.21% | 104 | 3.02% | 1,880 | 54.56% | 3,446 |
| Warren | 9,780 | 51.34% | 8,324 | 43.69% | 947 | 4.97% | 1,456 | 7.64% | 19,051 |
| Washington | 11,781 | 71.34% | 4,204 | 25.46% | 529 | 3.20% | 7,577 | 45.88% | 16,514 |
| Yalobusha | 2,925 | 49.16% | 2,791 | 46.91% | 234 | 3.93% | 134 | 2.25% | 5,950 |
| Yazoo | 5,740 | 58.63% | 3,633 | 37.11% | 417 | 4.26% | 2,107 | 21.52% | 9,790 |
| Totals | 192,343 | 67.11% | 83,542 | 29.15% | 10,741 | 3.75% | 108,801 | 37.96% | 286,626 |
|
County results |
|
|
|

Incumbent Republican Gregg Harper, who had represented the district since 2009, ran for re-election. He won re-election with 69% of the vote in 2014 and the district had a PVI of R+14.
Eliminated in primary
[edit]
- Dennis C. Quinn, candidate for this seat in 2014
Eliminated in primary
[edit]
| County[7] | Gregg Harper Republican |
Dennis C. Quinn Democratic |
Various candidates Other parties |
Margin | Total | ||||
|---|---|---|---|---|---|---|---|---|---|
| # | % | # | % | # | % | # | % | ||
| Adams | 6,236 | 47.69% | 6,366 | 48.68% | 475 | 3.63% | -130 | -0.99% | 13,077 |
| Amite | 4,249 | 61.98% | 2,352 | 34.31% | 254 | 3.71% | 1,897 | 27.67% | 6,855 |
| Clarke (part) | 4,810 | 72.32% | 1,649 | 24.79% | 192 | 2.89% | 3,161 | 47.53% | 6,651 |
| Covington | 5,503 | 64.08% | 2,740 | 31.90% | 345 | 4.02% | 2,763 | 32.17% | 8,588 |
| Franklin | 2,744 | 66.41% | 1,190 | 28.80% | 198 | 4.79% | 1,554 | 37.61% | 4,132 |
| Hinds (part) | 7,478 | 58.21% | 5,031 | 39.16% | 337 | 2.62% | 2,447 | 19.05% | 12,846 |
| Jasper | 4,235 | 51.15% | 3,782 | 45.68% | 262 | 3.16% | 453 | 5.47% | 8,279 |
| Jefferson Davis | 2,802 | 46.37% | 3,028 | 50.11% | 213 | 3.52% | -226 | -3.74% | 6,043 |
| Kemper | 2,204 | 49.53% | 2,113 | 47.48% | 133 | 2.99% | 91 | 2.04% | 4,450 |
| Lauderdale | 19,196 | 66.86% | 8,517 | 29.67% | 997 | 3.47% | 10,679 | 37.20% | 28,710 |
| Lawrence | 4,212 | 67.40% | 1,834 | 29.35% | 203 | 3.25% | 2,378 | 38.05% | 6,249 |
| Lincoln | 10,762 | 71.50% | 3,897 | 25.89% | 393 | 2.61% | 6,865 | 45.61% | 15,052 |
| Madison (part) | 27,997 | 74.96% | 8,272 | 22.15% | 1,079 | 2.89% | 19,725 | 52.81% | 37,348 |
| Neshoba | 7,901 | 76.13% | 2,149 | 20.71% | 328 | 3.16% | 5,752 | 55.42% | 10,378 |
| Newton | 6,752 | 72.89% | 2,199 | 23.74% | 312 | 3.37% | 4,553 | 49.15% | 9,263 |
| Noxubee | 1,515 | 30.50% | 3,292 | 66.28% | 160 | 3.22% | -1,777 | -35.78% | 4,967 |
| Oktibbeha (part) | 8,794 | 54.44% | 6,807 | 42.14% | 553 | 3.42% | 1,987 | 12.30% | 16,154 |
| Pike | 8,311 | 51.89% | 7,123 | 44.47% | 582 | 3.63% | 1,188 | 7.42% | 16,016 |
| Rankin | 48,160 | 78.02% | 11,015 | 17.84% | 2,553 | 4.14% | 37,145 | 60.18% | 61,728 |
| Scott | 6,570 | 63.92% | 3,420 | 33.27% | 288 | 2.80% | 3,150 | 30.65% | 10,278 |
| Simpson | 7,575 | 67.69% | 3,269 | 29.21% | 347 | 3.10% | 4,306 | 38.48% | 11,191 |
| Smith | 5,836 | 77.75% | 1,405 | 18.72% | 265 | 3.53% | 4,431 | 59.03% | 7,506 |
| Walthall | 4,093 | 61.65% | 2,317 | 34.90% | 229 | 3.45% | 1,776 | 26.75% | 6,639 |
| Wilkinson | 1,555 | 38.44% | 2,334 | 57.70% | 156 | 3.86% | -779 | -19.26% | 4,045 |
| Totals | 209,490 | 66.20% | 96,101 | 30.37% | 10,854 | 3.43% | 113,389 | 35.83% | 316,445 |
|
County results |
|
|
|

Incumbent Republican Steven Palazzo, who had represented the district since 2011, ran for re-election. He was re-elected with 70% of the vote in 2014 and the district had a PVI of R+21.
- Mark Gladney, helicopter pilot
Libertarian primary
[edit]
| County[7] | Steven Palazzo Republican |
Mark Gladney Democratic |
Various candidates Other parties |
Margin | Total | ||||
|---|---|---|---|---|---|---|---|---|---|
| # | % | # | % | # | % | # | % | ||
| Clarke (part) | 458 | 45.80% | 505 | 50.50% | 37 | 3.70% | -47 | -4.70% | 1,000 |
| Forrest | 14,943 | 53.95% | 10,402 | 37.56% | 2,353 | 8.50% | 4,541 | 16.39% | 27,698 |
| George | 8,213 | 84.50% | 996 | 10.25% | 511 | 5.26% | 7,217 | 74.25% | 9,720 |
| Greene | 3,801 | 71.87% | 829 | 15.67% | 659 | 12.46% | 2,972 | 56.19% | 5,289 |
| Hancock | 11,932 | 69.39% | 4,000 | 23.26% | 1,264 | 7.35% | 7,932 | 46.13% | 17,196 |
| Harrison | 35,463 | 57.12% | 21,796 | 35.11% | 4,826 | 7.77% | 13,667 | 22.01% | 62,085 |
| Jackson | 30,831 | 63.25% | 14,392 | 29.52% | 3,523 | 7.23% | 16,439 | 33.72% | 48,746 |
| Jones | 19,108 | 68.19% | 7,124 | 25.42% | 1,791 | 6.39% | 11,984 | 42.76% | 28,023 |
| Lamar | 17,753 | 72.72% | 4,910 | 20.11% | 1,750 | 7.17% | 12,843 | 52.61% | 24,413 |
| Marion | 7,758 | 67.09% | 3,326 | 28.76% | 479 | 4.14% | 4,432 | 38.33% | 11,563 |
| Pearl River | 16,613 | 78.04% | 3,426 | 16.09% | 1,248 | 5.86% | 13,187 | 61.95% | 21,287 |
| Perry | 3,762 | 70.37% | 1,102 | 20.61% | 482 | 9.02% | 2,660 | 49.76% | 5,346 |
| Stone | 4,848 | 69.91% | 1,559 | 22.48% | 528 | 7.61% | 3,289 | 47.43% | 6,935 |
| Wayne | 5,840 | 61.62% | 3,138 | 33.11% | 500 | 5.28% | 2,702 | 28.51% | 9,478 |
| Totals | 181,323 | 65.04% | 77,505 | 27.80% | 19,951 | 7.16% | 103,818 | 37.24% | 278,779 |
- ^ a b c d e “Mississippi Election Results”. Mississippi Secretary of State. Retrieved March 23, 2016.
- ^ a b c d “2016 House Race Ratings for November 7, 2016”. House: Race Ratings. Cook Political Report. Retrieved November 12, 2016.
- ^ a b c d “Daily Kos Elections House race ratings: Initial ratings for 2016”. Daily Kos Elections. Retrieved November 7, 2016.
- ^ a b c d “2016 House Ratings (November 3, 2016)”. House Ratings. The Rothenberg Political Report. Retrieved November 3, 2016.
- ^ a b c d “2016 House”. Sabato’s Crystal Ball. November 7, 2016. Retrieved November 7, 2016.
- ^ a b c d “Battle for the House 2016”. Real Clear Politics. Retrieved October 31, 2016.
- ^ a b c d e f g h Hosemann, Delbert (November 8, 2016). “Statewide Recapitulation Report” (PDF). Secretary of State of Mississippi. Archived (PDF) from the original on June 27, 2025. Retrieved September 8, 2025.

