


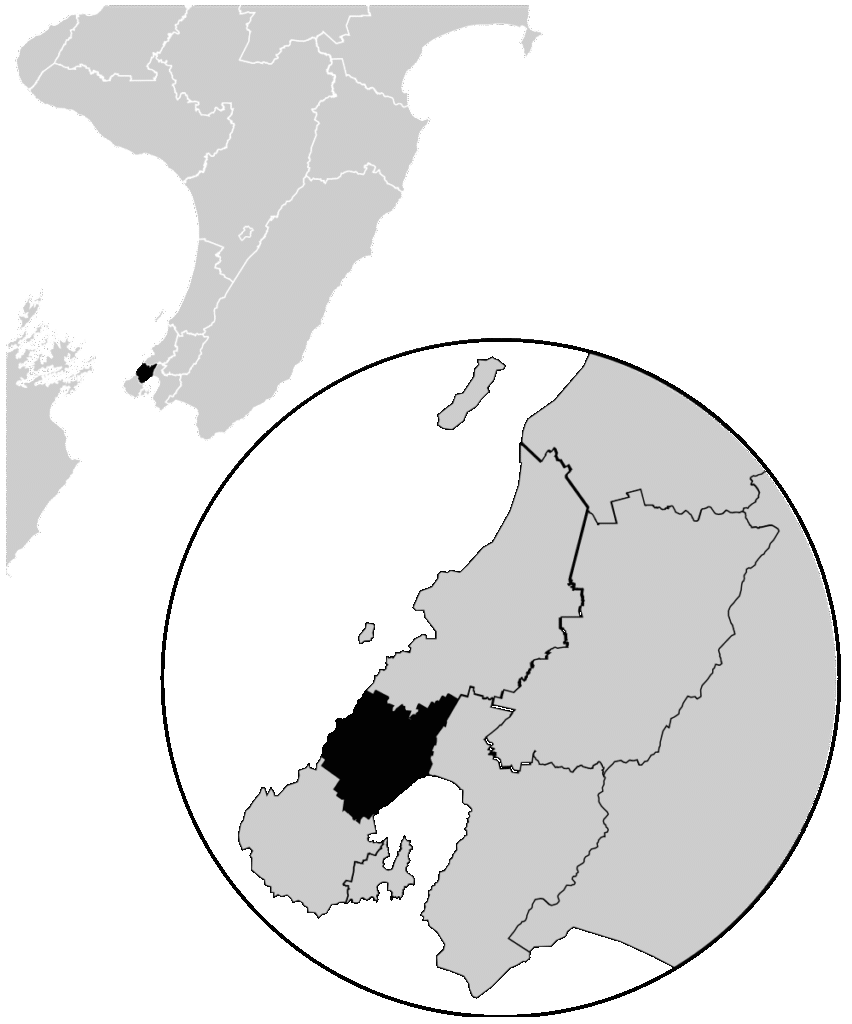
Electoral district in Wellington, New Zealand
Ōhāriu, previously spelled Ohariu and then Ōhariu, is a New Zealand parliamentary electorate returning one Member of Parliament to the House of Representatives. It first existed from 1978 to 1993, and was recreated for the 2008 election. In 2008, it was the successor to Ohariu-Belmont, first contested at the first mixed-member proportional (MMP) election in 1996. Through its existence Ohariu-Belmont was represented by Peter Dunne, leader of the United Future party. Dunne contested and won the recreated electorate in 2008. He announced on 21 August 2017 that he would not stand in the 2017 general election.
The 1977 electoral redistribution was the most overtly political since the Representation Commission had been established through an amendment to the Representation Act in 1886, initiated by Muldoon‘s National Government. As part of the 1976 census, a large number of people failed to fill in an electoral re-registration card, and census staff had not been given the authority to insist on the card being completed. This had little practical effect for people on the general roll, but it transferred Māori to the general roll if the card was not handed in. Together with a northward shift of New Zealand’s population, this resulted in five new electorates having to be created in the upper part of the North Island. The electoral redistribution was very disruptive, and 22 electorates were abolished, while 27 electorates were newly created (including Ohariu) or re-established. These changes came into effect for the 1978 election.
The Ohariu electorate replaced the Karori electorate, but did not include any of Khandallah or Ngaio.
In 2008, the boundaries of the Ohariu-Belmont and Ōhariu electorates were near identical except for the removal of the eponymous Lower Hutt suburb of Belmont into the Rimutaka electorate and the addition of Crofton Downs from Wellington Central. The new electorate contained the section of Wellington City between Crofton Downs and southern Tawa, including Ngaio, Khandallah, Johnsonville and Newlands. The rest of the electorate consisted of Lower Hutt’s hill suburbs of Korokoro, Maungaraki and Normandale. Ōhariu was one of eleven electorate names to include a macron, for the first time. The name was later changed to include a second macron.
Both Ohariu-Belmont and Ōhāriu are young and wealthy; it has the largest number of 30- to 49-year-olds in the country, and the second highest number of families earning between $70,000 and $100,000 per year. 69% of its population is New Zealand European, 14% Asian and 8% Māori.[5]
Despite Dunne having a 7,702 vote majority in Ohariu-Belmont at the 2005 election,[6] United Future’s performance was less impressive. In 2005 it won just 5.6% of the party vote (down from 13.0% in 2002) in an electorate dominated by the big two parties: National came out on top in the party vote with 43.1%, beating Labour by 3.6%, having been reduced to 24.4% three years earlier.[7]
Historically Ohariu (without macrons) was an electorate based around north and western Wellington, contested between 1978 and 1990. A substantial redrawing of Wellington’s boundaries ahead of the final first-past-the-post election in 1993 led to Ohariu being divided between Wellington-Karori and the new electorate of Onslow. Dunne, then a member of the Labour Party, was the MP for the old Ohariu between 1984 until its abolition, and won Onslow in 1993.
The electorate would be discontinued for the 2026 general election to accommodate the loss of one North Island electorate, with its population centers being divided between Kenepuru, Wellington North and Hutt South.[8]
Members of Parliament
[edit]
Key
National
Labour
United Future
Green
Members of Parliament elected from party lists in elections where that person also unsuccessfully contested the Ōhāriu electorate. Unless otherwise stated, all MPs terms began and ended at general elections.
| 2023 general election: Ōhāriu[9] | |||||||||
|---|---|---|---|---|---|---|---|---|---|
| Notes: |
Blue background denotes the winner of the electorate vote. |
||||||||
| Party | Candidate | Votes | % | ±% | Party votes | % | ±% | ||
| Labour | 17,565 | 41.15 | -11.40 | 12,457 | 28.95 | -21.87 | |||
| National | Nicola Willis | 16,305 | 38.20 | +13.05 | 14,841 | 34.49 | +12.29 | ||
| Green | Stephanie Rodgers | 4,412 | 10.33 | +5.24 | 8,623 | 20.04 | +6.49 | ||
| Opportunities | Jessica Hammond | 2,975 | 6.97 | -3.21 | 1,882 | 4.37 | +1.58 | ||
| ACT | Paul Day | 759 | 1.77 | -0.08 | 2,524 | 5.86 | -0.21 | ||
| Vision New Zealand | Patrick Lim | 214 | 0.50 | ||||||
| Independent | Martin Jenkins | 124 | 0.29 | ||||||
| NZ First | 1,442 | 3.35 | +1.47 | ||||||
| Te Pāti Māori | 519 | 1.20 | +0.85 | ||||||
| NewZeal | 119 | 0.27 | +0.27 | ||||||
| Legalise Cannabis | 114 | 0.26 | +0.08 | ||||||
| NZ Loyal | 112 | 0.26 | +0.26 | ||||||
| New Conservative | 65 | 0.15 | -0.71 | ||||||
| Animal Justice | 62 | 0.14 | +0.14 | ||||||
| Freedoms NZ | 58 | 0.13 | +0.13 | ||||||
| Women’s Rights | 31 | 0.07 | +0.07 | ||||||
| DemocracyNZ | 25 | 0.05 | +0.05 | ||||||
| Leighton Baker Party | 12 | 0.02 | +0.02 | ||||||
| New Nation | 11 | 0.02 | +0.02 | ||||||
| Informal votes | 324 | 121 | |||||||
| Total valid votes | 42,678 | 43,018 | |||||||
| Turnout | |||||||||
| Labour hold | Majority | 1,260 | 2.95 | ||||||

| 2020 general election: Ōhāriu[10] | |||||||||
|---|---|---|---|---|---|---|---|---|---|
| Notes: |
Blue background denotes the winner of the electorate vote. |
||||||||
| Party | Candidate | Votes | % | ±% | Party votes | % | ±% | ||
| Labour | 22,937 | 52.55 | +9.58 | 22,282 | 50.82 | +15.38 | |||
| National | Brett Hudson | 10,976 | 25.15 | −15.18 | 9,732 | 22.20 | −23.08 | ||
| Opportunities | Jessica Hammond | 4,443 | 10.18 | +2.89 | 1,221 | 2.79 | −1.37 | ||
| Green | John Ranta | 2,221 | 5.09 | −1.25 | 5,940 | 13.55 | +3.94 | ||
| NZ First | Tracey Martin | 928 | 2.13 | +0.24 | 824 | 1.88 | −1.84 | ||
| ACT | Sean Fitzpatrick | 809 | 1.85 | +1.38 | 2,662 | 6.07 | +5.48 | ||
| New Conservative | Philip Lynch | 357 | 0.82 | — | 375 | 0.86 | +0.68 | ||
| ONE | Allan Cawood | 197 | 0.45 | — | 143 | 0.33 | — | ||
| Advance NZ | Jolene Smith | 133 | 0.30 | — | 149 | 0.34 | — | ||
| Not A Party | Liam Walsh | 49 | 0.11 | — | |||||
| Māori Party | 153 | 0.35 | −0.11 | ||||||
| Legalise Cannabis | 80 | 0.18 | +0.01 | ||||||
| Sustainable NZ | 19 | 0.04 | — | ||||||
| Vision New Zealand | 17 | 0.04 | — | ||||||
| Outdoors | 15 | 0.03 | — | ||||||
| TEA | 12 | 0.03 | — | ||||||
| Social Credit | 8 | 0.02 | ±0.00 | ||||||
| Heartland | 1 | 0.002 | — | ||||||
| Informal votes | 596 | 209 | |||||||
| Total valid votes | 43,646 | 43,842 | |||||||
| Turnout | 43,989 | 87.73 | +1.64 | ||||||
| Labour hold | Majority | 11,961 | 27.40 | +24.76 | |||||
| 2017 general election: Ōhāriu[11] | |||||||||
|---|---|---|---|---|---|---|---|---|---|
| Notes: |
Blue background denotes the winner of the electorate vote. |
||||||||
| Party | Candidate | Votes | % | ±% | Party votes | % | ±% | ||
| Labour | Greg O’Connor | 17,084 | 42.97 | +8.31 | 14,306 | 35.44 | +12.03 | ||
| National | Brett Hudson | 16,033 | 40.33 | +23.83 | 18,277 | 45.28 | −4.95 | ||
| Opportunities | Jessica Hammond | 2,898 | 7.29 | — | 1,678 | 4.16 | — | ||
| Green | Tane Woodley | 2,522 | 6.34 | −1.11 | 3,881 | 9.61 | −5.39 | ||
| NZ First | Lisa Close | 751 | 1.89 | +0.02 | 1,502 | 3.72 | −1.05 | ||
| United Future | Bale Nadakuitavuki | 284 | 0.71 | −35.87 | 78 | 0.19 | −0.54 | ||
| ACT | Andie Moore | 185 | 0.47 | −0.09 | 239 | 0.59 | −0.18 | ||
| Māori Party | 186 | 0.46 | −0.10 | ||||||
| Conservative | 71 | 0.18 | −2.81 | ||||||
| Legalise Cannabis | 68 | 0.17 | −0.22 | ||||||
| Outdoors | 23 | 0.06 | — | ||||||
| Ban 1080 | 18 | 0.04 | ±0.00 | ||||||
| People’s Party | 13 | 0.03 | — | ||||||
| Democrats | 8 | 0.02 | −0.04 | ||||||
| Internet | 8 | 0.02 | −0.67[d] | ||||||
| Mana Party | 5 | 0.01 | −0.68[e] | ||||||
| Informal votes | 305 | 84 | |||||||
| Total valid votes | 39,757 | 40,361 | |||||||
| Turnout | 40,445 | ||||||||
| Labour gain from United Future | Majority | 1,051 | 2.64 | +0.73 | |||||
| 2014 general election: Ōhāriu[12] | |||||||||
|---|---|---|---|---|---|---|---|---|---|
| Notes: |
Blue background denotes the winner of the electorate vote. |
||||||||
| Party | Candidate | Votes | % | ±% | Party votes | % | ±% | ||
| United Future | 13,569 | 36.58 | −2.00 | 273 | 0.73 | −1.05 | |||
| Labour | Ginny Andersen | 12,859 | 34.66 | −0.18 | 8,771 | 23.42 | −3.11 | ||
| National | Brett Hudson | 6,120 | 16.50 | −2.06 | 18,810 | 50.23 | +0.63 | ||
| Green | Tane Woodley | 2,764 | 7.45 | +1.65 | 5,623 | 15.01 | +0.59 | ||
| Conservative | Michael Brunner | 1,038 | 2.80 | +1.78 | 1,118 | 2.99 | +1.31 | ||
| Independent | Sue Hamill | 211 | 0.57 | +0.57 | |||||
| ACT | Sean Fitzpatrick | 209 | 0.56 | +0.56 | 250 | 0.67 | −0.09 | ||
| Democrats | Alida Steemson | 46 | 0.12 | +0.12 | 22 | 0.06 | +0.03 | ||
| NZ First | 1,781 | 4.76 | +0.85 | ||||||
| Internet Mana | 258 | 0.69 | +0.50[f] | ||||||
| Māori Party | 215 | 0.57 | +0.04 | ||||||
| Legalise Cannabis | 146 | 0.39 | −0.03 | ||||||
| Civilian | 29 | 0.08 | +0.08 | ||||||
| Ban 1080 | 15 | 0.04 | +0.04 | ||||||
| Independent Coalition | 9 | 0.02 | +0.02 | ||||||
| Focus | 4 | 0.01 | +0.01 | ||||||
| Informal votes | 283 | 126 | |||||||
| Total valid votes | 37,099 | 37,450 | |||||||
| United Future hold | Majority | 710 | 1.91 | −1.83 | |||||
| 2011 general election: Ōhāriu[13] | |||||||||
|---|---|---|---|---|---|---|---|---|---|
| Notes: |
Blue background denotes the winner of the electorate vote. |
||||||||
| Party | Candidate | Votes | % | ±% | Party votes | % | ±% | ||
| United Future | 14,357 | 38.58 | +5.97 | 672 | 1.78 | -0.43 | |||
| Labour | Charles Chauvel | 12,965 | 34.84 | +4.89 | 10,036 | 26.53 | -6.80 | ||
| National | Katrina Shanks | 6,907 | 18.56 | -7.97 | 18,764 | 49.60 | +3.33 | ||
| Green | Gareth Hughes | 2,160 | 5.80 | -1.26 | 5,453 | 14.42 | +5.28 | ||
| Conservative | Stephen Woodnutt | 378 | 1.02 | +1.02 | 636 | 1.68 | +1.68 | ||
| NZ First | Hugh Barr | 339 | 0.91 | +0.91 | 1,478 | 3.91 | +1.82 | ||
| Libertarianz | Sean Fitzpatrick | 109 | 0.29 | +0.29 | 47 | 0.12 | +0.07 | ||
| ACT | 286 | 0.76 | -2.66 | ||||||
| Māori Party | 201 | 0.53 | -0.20 | ||||||
| Legalise Cannabis | 160 | 0.42 | +0.11 | ||||||
| Mana | 73 | 0.19 | +0.19 | ||||||
| Alliance | 12 | 0.03 | -0.11 | ||||||
| Democrats | 10 | 0.03 | +0.003 | ||||||
| Informal votes | 369 | 137 | |||||||
| Total valid votes | 37,215 | 37,828 | |||||||
| United Future hold | Majority | 1,392 | 3.74 | +1.07 | |||||
Electorate (as at 26 November 2011): 46,740[14]
| 2008 general election: Ōhariu[15] | |||||||||
|---|---|---|---|---|---|---|---|---|---|
| Notes: |
Blue background denotes the winner of the electorate vote. |
||||||||
| Party | Candidate | Votes | % | ±% | Party votes | % | ±% | ||
| United Future | 12,303 | 32.61 | 843 | 2.21 | |||||
| Labour | Charles Chauvel | 11,297 | 29.95 | 12,728 | 33.33 | ||||
| National | Katrina Shanks | 10,009 | 26.53 | 17,670 | 46.27 | ||||
| Green | Gareth Hughes | 2,665 | 7.06 | 3,488 | 9.13 | ||||
| Kiwi | Joel Sison | 522 | 1.38 | 283 | 0.74 | ||||
| ACT | Colin du Plessis | 487 | 1.29 | 1,304 | 3.41 | ||||
| Legalise Cannabis | Danyl Strype | 330 | 0.87 | 119 | 0.31 | ||||
| Alliance | Kelly Buchanan | 111 | 0.29 | 55 | 0.14 | ||||
| NZ First | 798 | 2.09 | |||||||
| Māori Party | 278 | 0.73 | |||||||
| Progressive | 273 | 0.71 | |||||||
| Bill and Ben | 208 | 0.54 | |||||||
| Family Party | 65 | 0.17 | |||||||
| Pacific | 22 | 0.06 | |||||||
| Libertarianz | 20 | 0.05 | |||||||
| Workers Party | 11 | 0.03 | |||||||
| Democrats | 9 | 0.02 | |||||||
| RAM | 7 | 0.02 | |||||||
| RONZ | 7 | 0.02 | |||||||
| Informal votes | 242 | 88 | |||||||
| Total valid votes | 37,724 | 38,188 | |||||||
| United Future win new seat | Majority | 1,006 | 2.67 | ||||||
- ^ Hughes entered Parliament on 11 February 2010, following the resignation of Jeanette Fitzsimons.
- ^ Chauvel resigned from Parliament on 11 March 2013.
- ^ Shanks resigned from Parliament on 21 January 2014.
- ^ 2017 Internet swing is relative to the votes for Internet Mana in 2014; it shared a party list with Mana in the 2014 election.
- ^ 2017 Mana swing is relative to the votes for Internet Mana in 2014; it shared a party list with Internet in the 2014 election.
- ^ 2014 Internet Mana swing is relative to the votes for Mana in 2011; it shared a party list with Internet in the 2014 election.
- McRobie, Alan (1989). Electoral Atlas of New Zealand. Wellington: GP Books. ISBN 0-477-01384-8.
- Wilson, James Oakley (1985) [First published in 1913]. New Zealand Parliamentary Record, 1840–1984 (4th ed.). Wellington: V.R. Ward, Govt. Printer. OCLC 154283103.
- Norton, Clifford (1988). New Zealand Parliamentary Election Results 1946–1987: Occasional Publications No 1, Department of Political Science. Wellington: Victoria University of Wellington. ISBN 0-475-11200-8.
41°13′S 174°49′E / 41.21°S 174.81°E / -41.21; 174.81


